
In the previous guide, we covered how to install Appium Inspector and start your first session with a mobile app. Now that the setup is behind us, it's time to explore what Appium Inspector can actually do.
Appium Inspector is a GUI tool that connects to a running Appium server and gives you a visual window into your application under test. At its core, it provides inspection capabilities for your app's page source — but it goes well beyond that. Through its panels and tabs, you can interact with the app screenshot directly, explore and search for UI elements, execute driver commands, build and run custom gestures, and record your interactions as ready-to-use automation code.
Because Appium Inspector is a tool you'll use constantly throughout your mobile automation work — whether on Android, iOS, or both — having a solid understanding of every feature it offers is essential. This guide walks you through each panel and tab in detail, so you know exactly what's available and how to make the most of it.
Prerequisites
Before following this guide, make sure Appium Inspector is installed and you have successfully started at least one session with a mobile app. If you haven't done this yet, start with the previous guide:

For the examples in this article, we'll be using the same demo applications as before — android.wdio.native.app.v2.0.0.apk for Android and wdioDemoApp.app for iOS. Both are available to download from the WebDriverIO native demo app repository on GitHub.
Session builder
When you first launch Appium Inspector, you land on the Session Builder screen — this is where you configure your server settings and session capabilities before connecting to a device.
We covered how to create and launch a new session in the previous guide. This time, we'll start by loading a previously saved capability set to get straight into the features.
To launch a saved session, navigate to the Saved Capability Sets tab and select the capability set you saved previously. If you haven't saved one yet, you can do so by entering your desired capabilities under the Capability Builder tab and clicking Save As… at the bottom — give it a name so you can reuse it later.
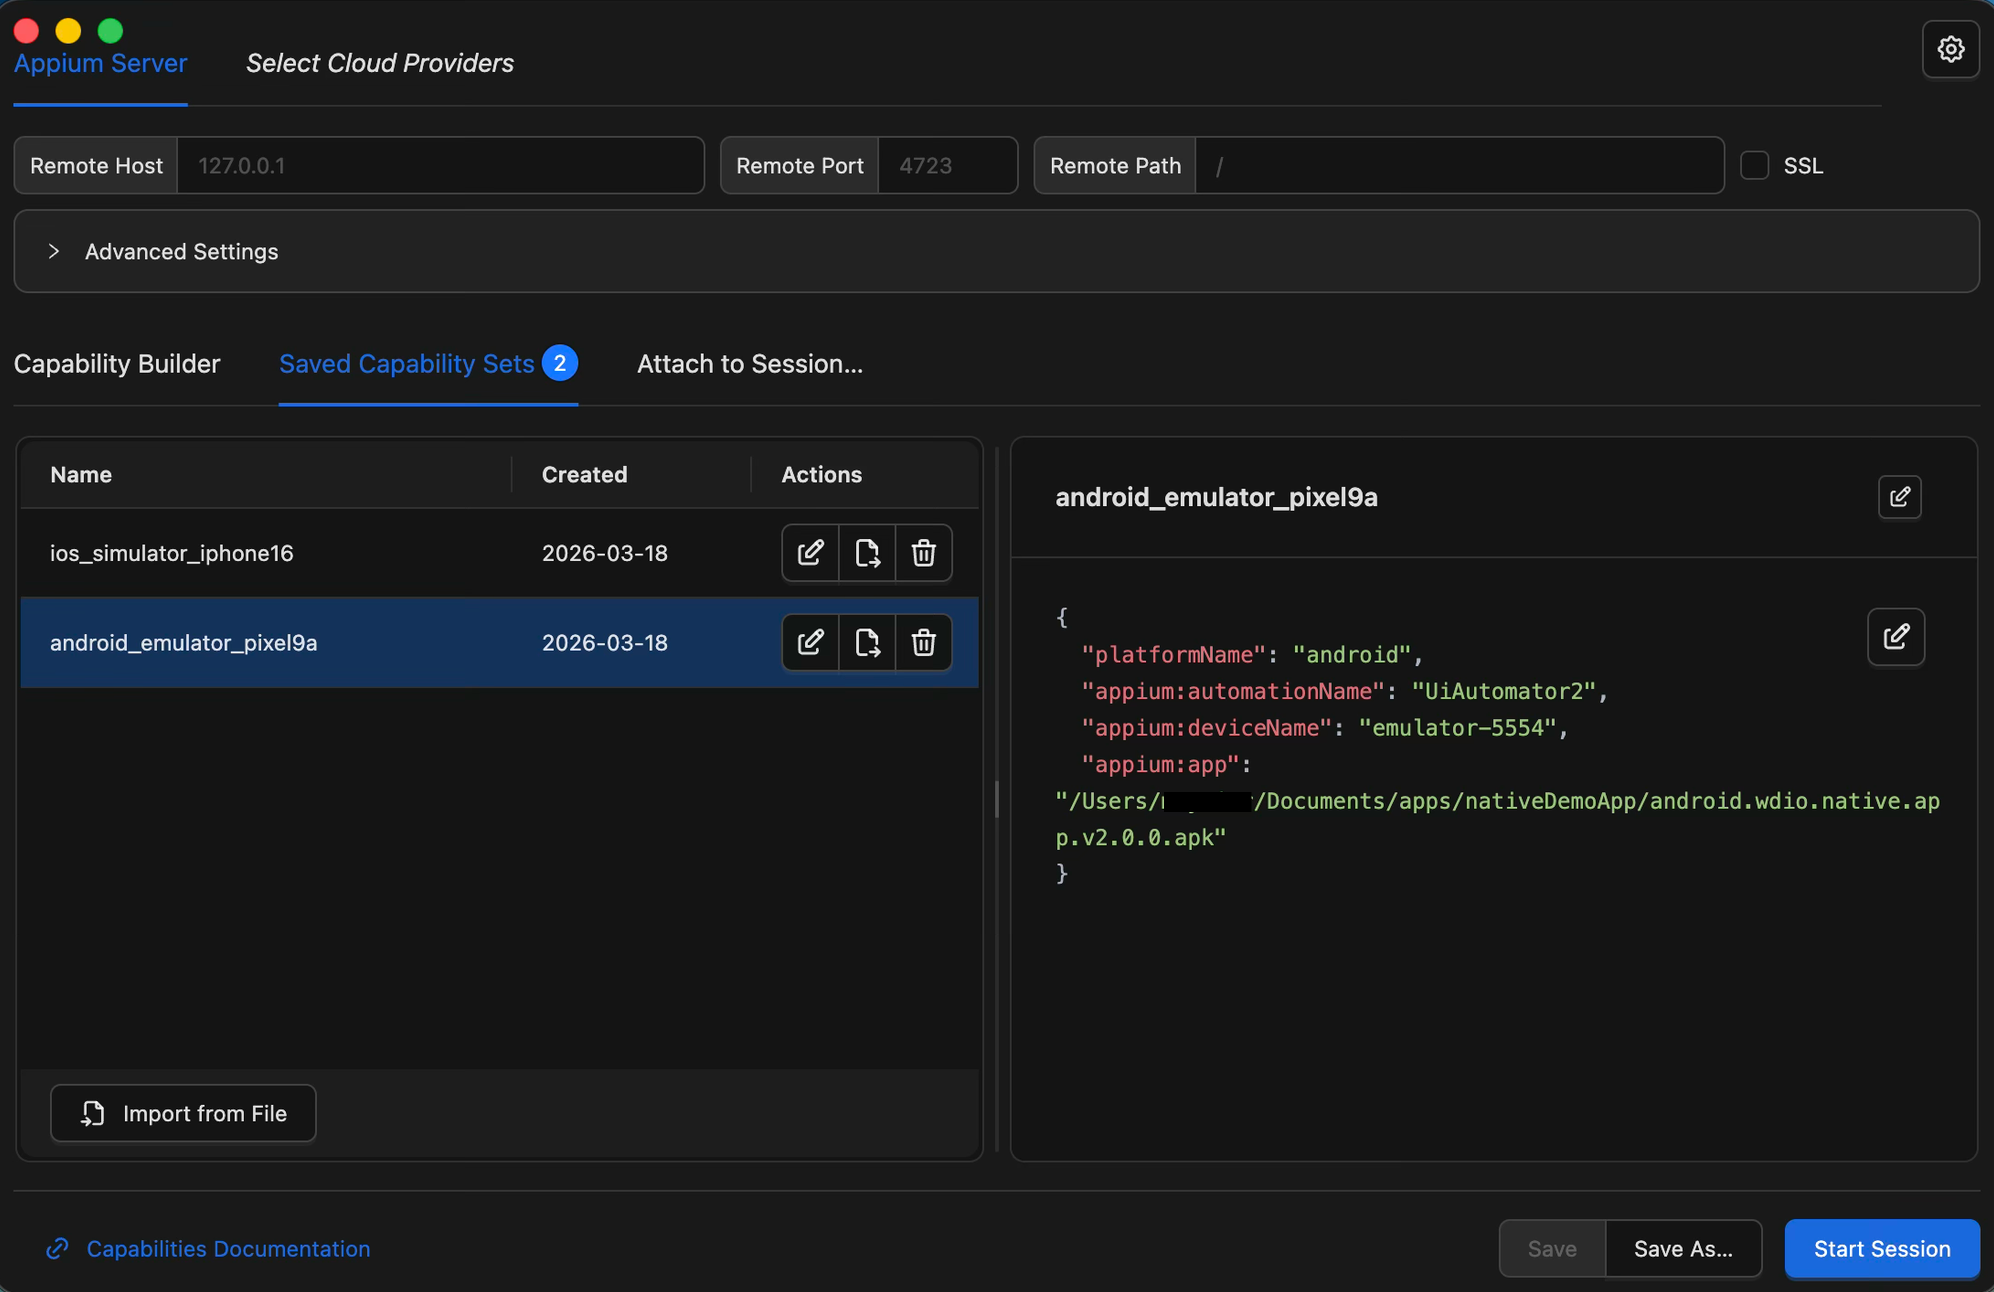
We'll use the Android capability set for this example, but the steps are identical for iOS — just load your iOS capabilities instead. Once the session starts, you'll land on the Session Inspector screen.
Session Inspector
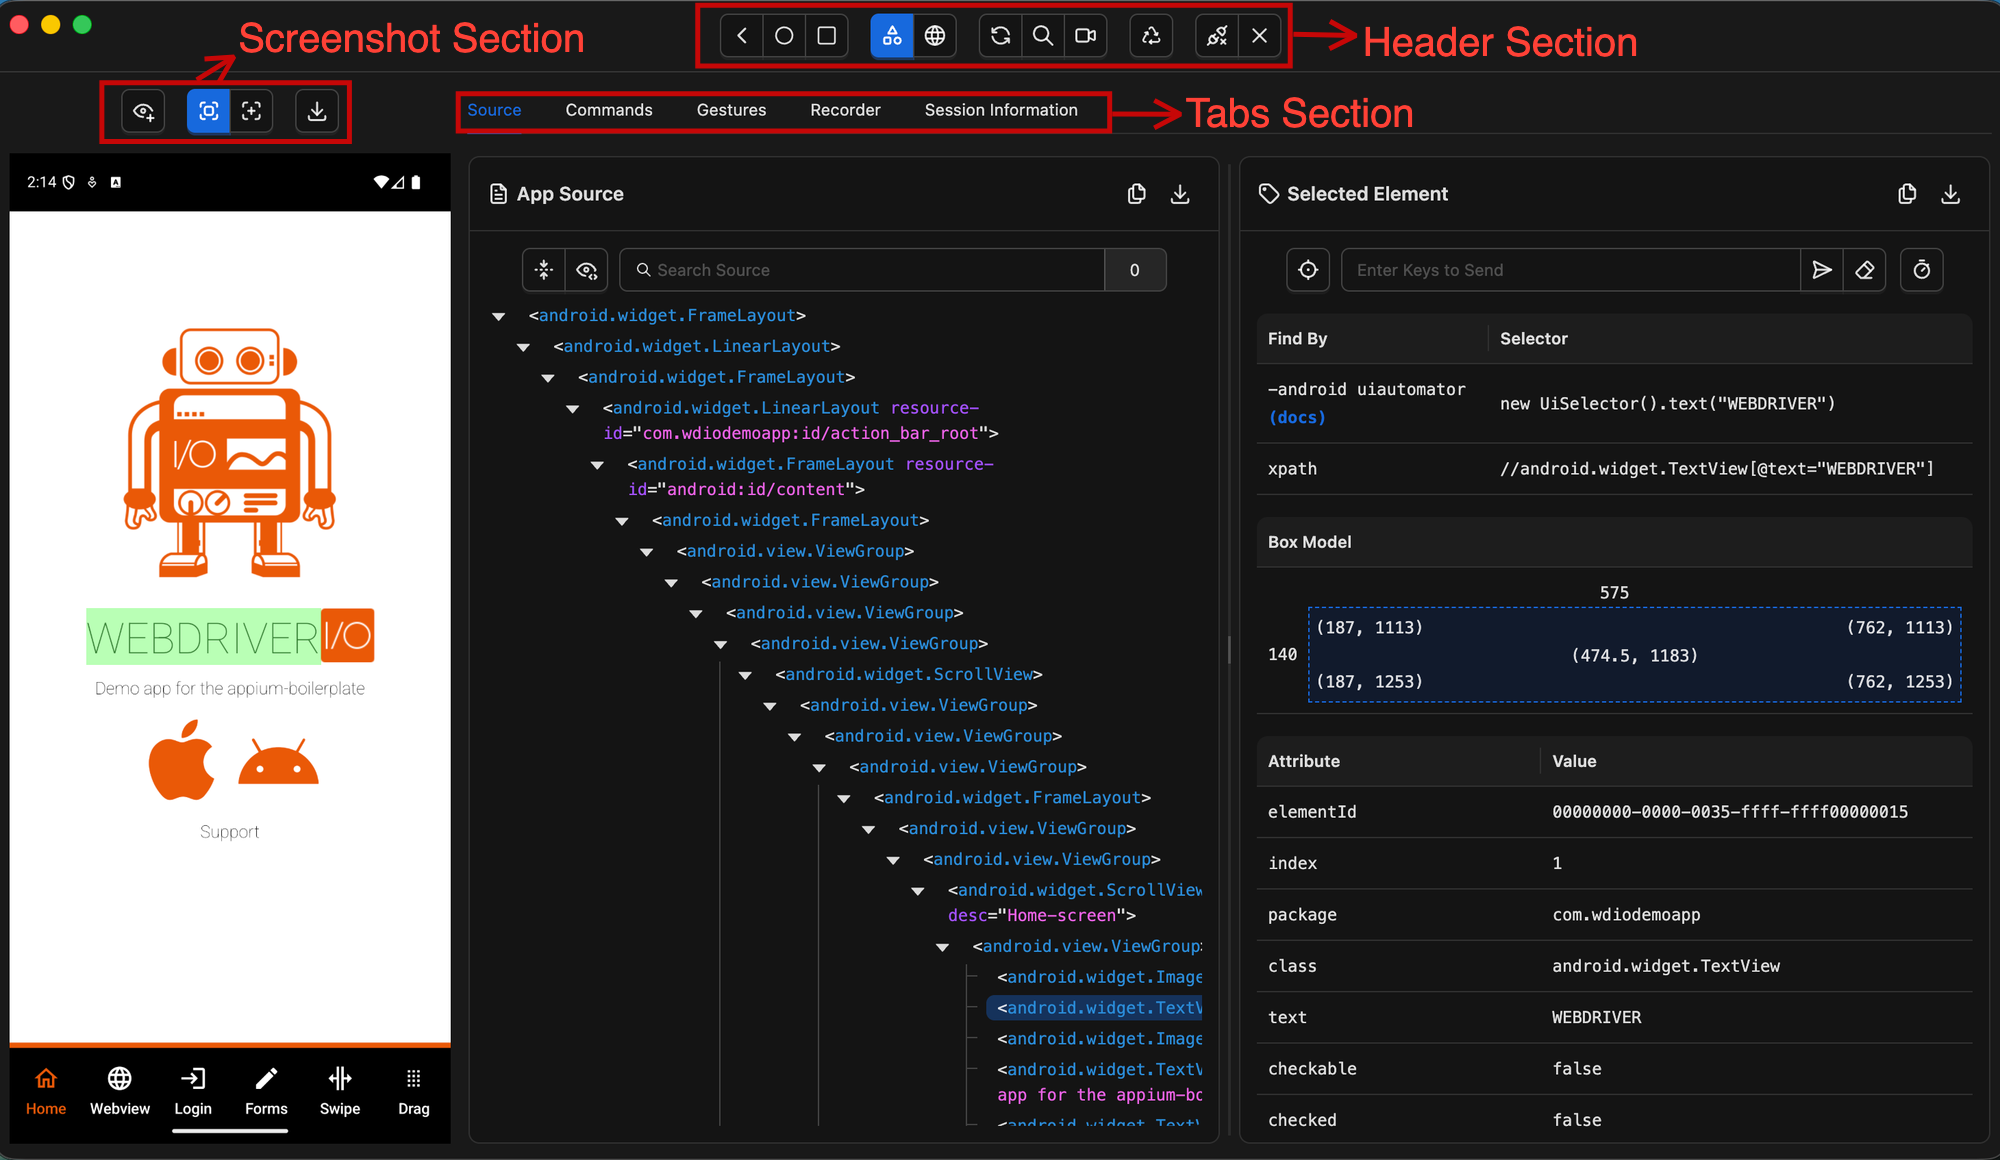
The Session Inspector is the main workspace of Appium Inspector — the screen you'll spend most of your time in. It is divided into three main sections:
- Header — contains the primary controls for interacting with the device and the application source
- Screenshot — displays a live preview of your application, also referred to as the Application Preview
- Tabs — provides access to the App Source (element hierarchy), Element Properties, and additional features such as Gestures, Recorder, and Commands
Header Section
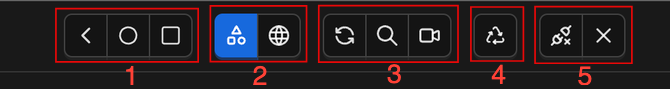
The Header section is organised into five groups, each serving a distinct purpose:
- Device System Buttons — simulates physical device interactions such as navigating back, going home, or rotating the screen
- Context Switcher — allows you to switch between the native app context and a web context (WebView), which is essential when testing hybrid applications
- Source & Session Controls — provides controls for refreshing the app source and screenshot, searching for elements within the page source, and toggling the session recorder
- Reload on Disconnect — automatically reloads the Inspector session if the connection to the Appium server is lost, helping you recover without having to restart manually
- Session Management — contains the options to detach from the current session without closing it, or to quit the session entirely and return to the Session Builder screen
While all five groups have their role, the controls you'll reach for most often during your day-to-day inspection work are in the Source & Session Controls group. Let's take a closer look at each of those three buttons.
- Refresh Source & Screenshot

This is one of the buttons you will use most frequently in Appium Inspector. By default, the application screenshot and page source do not update automatically — whenever you navigate to a new screen on your device, emulator, or simulator, they remain frozen on the last captured state.
To inspect a new screen, click the Refresh Source & Screenshot button. This captures a fresh screenshot and reloads the page source to reflect the current state of the app, giving you an accurate view of the elements available on that screen.
- Search for Element

This button opens a modal window that allows you to search for elements directly within the current application's XML source — without having to manually browse through the element hierarchy.
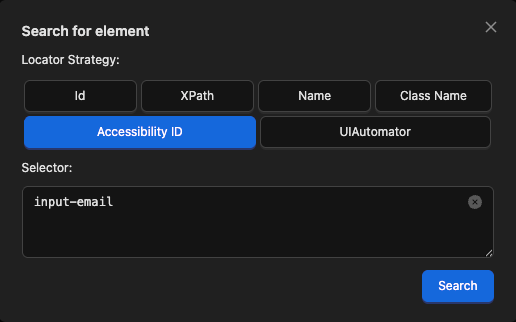
To perform a search, you need to provide two things:
- Locator Strategy — the method used to find the element (e.g. Accessibility ID, XPath, class name). The available strategies depend on the driver you are using — Appium Inspector automatically hides strategies that are not supported by the current driver, so you only see what is relevant to your session. Locator strategies are a topic of their own — we will cover them in detail in the next article.
- Selector String — the value to search for, based on the chosen locator strategy (e.g. an accessibility ID value or an XPath expression)
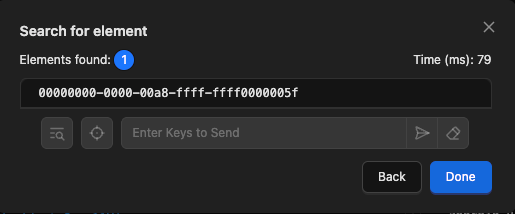
Once you have selected a locator strategy and entered your selector string, click Search. The results screen will then display:
- The total number of matching elements found
- The time taken to complete the search
- A list of selectable element IDs that you can click to inspect further
If no elements are found, verify that your selector string is correct and that the element is visible on the current screen. If it is not, navigate to the correct screen, refresh the source, and search again.
- Start/Pause Recording

This button enables or disables the session recorder, which captures your interactions with the application and translates them into ready-to-use Appium client code.
The following interactions can be recorded:
- Element actions — tap, send keys, and clear on a specific element
- Generic actions — tap and swipe directly on the application screenshot
- Device system actions — physical device interactions such as back, home, and rotate
- Driver commands — commands executed through the Commands tab
Once recording is enabled, every supported interaction you perform is automatically captured and translated into Appium client code in the Recorder tab in real time. We will take a closer look at the Recorder tab and walk through the generated code in detail later in this guide.
Screenshot Section
Now let's look at the Screenshot section, located in the top left of the Session Inspector. This section displays a screenshot of the current device screen and serves as your primary visual reference for the app under test — but it does more than just show a static image. It also provides several ways to interact directly with the app from within Inspector.
By default, the screenshot is a static image that only updates when you manually trigger a refresh, as we saw earlier with the Refresh Source & Screenshot button. The same behaviour applies to the page source. Any interactions you perform on the device, emulator, or simulator outside of Appium Inspector will not cause the screenshot to update automatically.
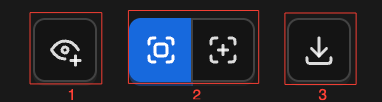
The screenshot section provides three controls:
- Toggle Element Handles

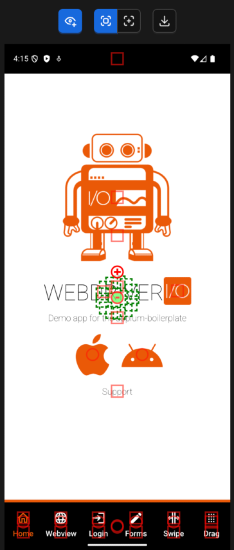
This button toggles the visibility of highlighter handles for all identified elements on the screen. Highlighter handles are particularly useful when multiple elements overlap around the same coordinates — in this case, the overlapping elements are merged into a single group handle, identified by the + symbol. Clicking the group handle expands it to reveal the individual element handles, allowing you to select and inspect each one separately.
- Interaction Mode
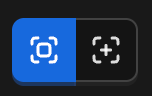
The Interaction Mode controls allow you to switch between two modes:
- Element Mode (default) — hovering over the screenshot highlights any detected elements. Clicking on a highlighted element selects it in the page source and displays its details in the Element Properties panel.
- Coordinates Mode — a coordinates overlay appears in the top left corner of the screenshot. Hovering over the screenshot updates the overlay with the exact coordinates of your cursor on the device screen. Clicking or swiping the screenshot executes a real tap or swipe action directly on the device.
- Download Screenshot

This button saves the currently displayed screenshot to your computer as a .PNG file — useful for documenting bugs or capturing the state of the app at a specific point during your inspection session.
Tabs Section
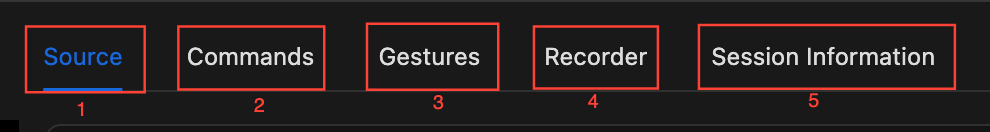
The Tabs section consists of five tabs: Source, Commands, Gestures, Recorder, and Session Information. Let's walk through each one.
Source Tab
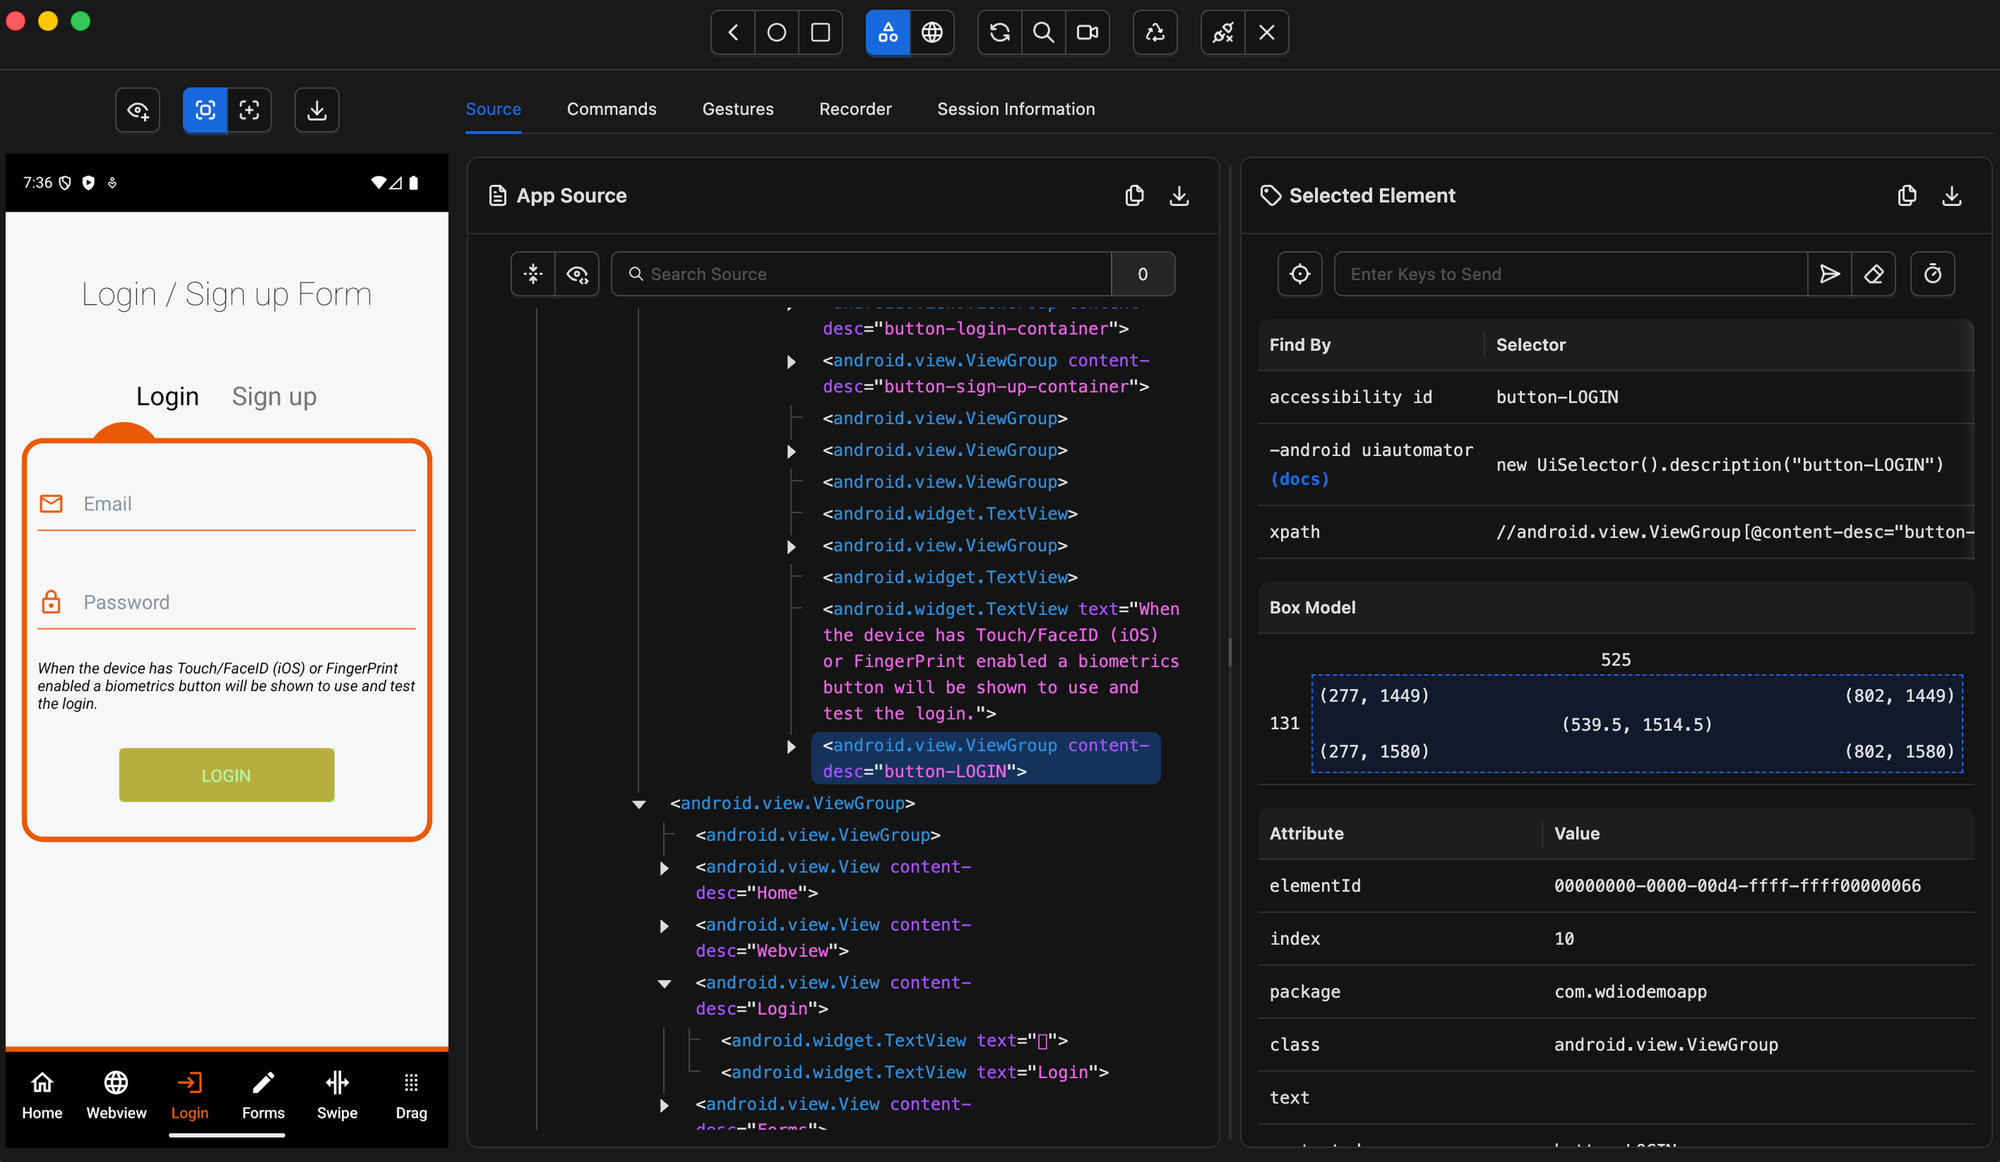
The Source tab is the default tab opened when a session starts. It is divided into two connected parts: the Application Source panel, which is always visible, and the Selected Element panel, which appears on the right when an element is selected.
- Application Source Panel
The Application Source panel is the central panel of the Source tab. It displays the application's page source XML in a tree-like structure, giving you a full view of every element on the current screen.
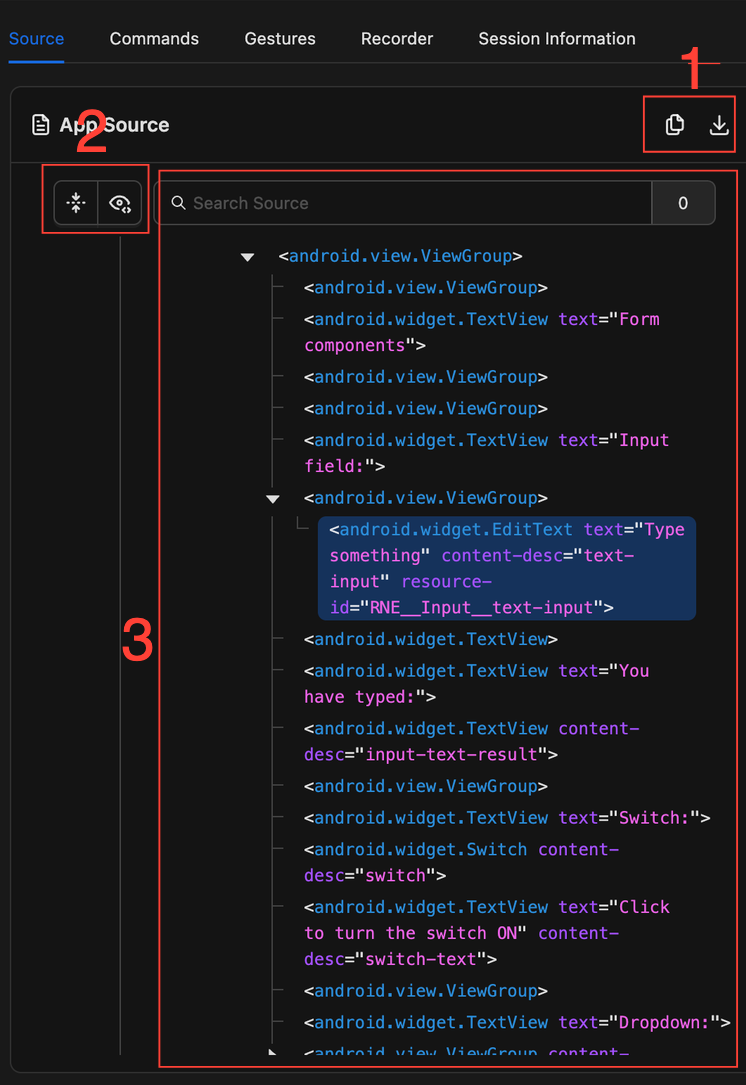
The panel is organized into three parts:
- Header buttons — copy the full application XML to the clipboard or download it as an
.xmlfile - Source actions — collapse all nodes in the source tree, toggle the visibility of non-important element attributes or perform a plain text search directly within the source XML
- Source tree — the element hierarchy generated from the XML data returned by the Appium driver. By default, each element entry displays its class name along with a selection of important attributes such as
valueandcontent-desc. All other attributes are hidden by default to keep the tree readable, but can be revealed using the Toggle Attributes button
Clicking on any element in the source tree triggers three actions simultaneously:
- The selected element entry is highlighted in the source tree
- The corresponding element highlighter appears in the Screenshot panel (if Element Mode is active)
- The element's details are displayed in the Selected Element panel
By default, the source XML only updates when a refresh is triggered. A refresh occurs automatically when you perform any of the following actions:
- Interacting with an element (tap, send keys, or clear)
- Interacting with the screenshot (tap or swipe)
- Simulating device system actions
- Executing driver commands (depending on the command)
- Executing custom gestures
- Pressing the Refresh Source & Screenshot button manually
Note: Any interactions performed directly on your device, emulator, or simulator — outside of Appium Inspector — will not trigger a source refresh. Always interact through Appium Inspector to keep the Source Tree in sync.
- Selected Element panel
Once an element is selected in the source tree, the Selected Element panel appears to the right of the Source tab. It is divided into five parts:
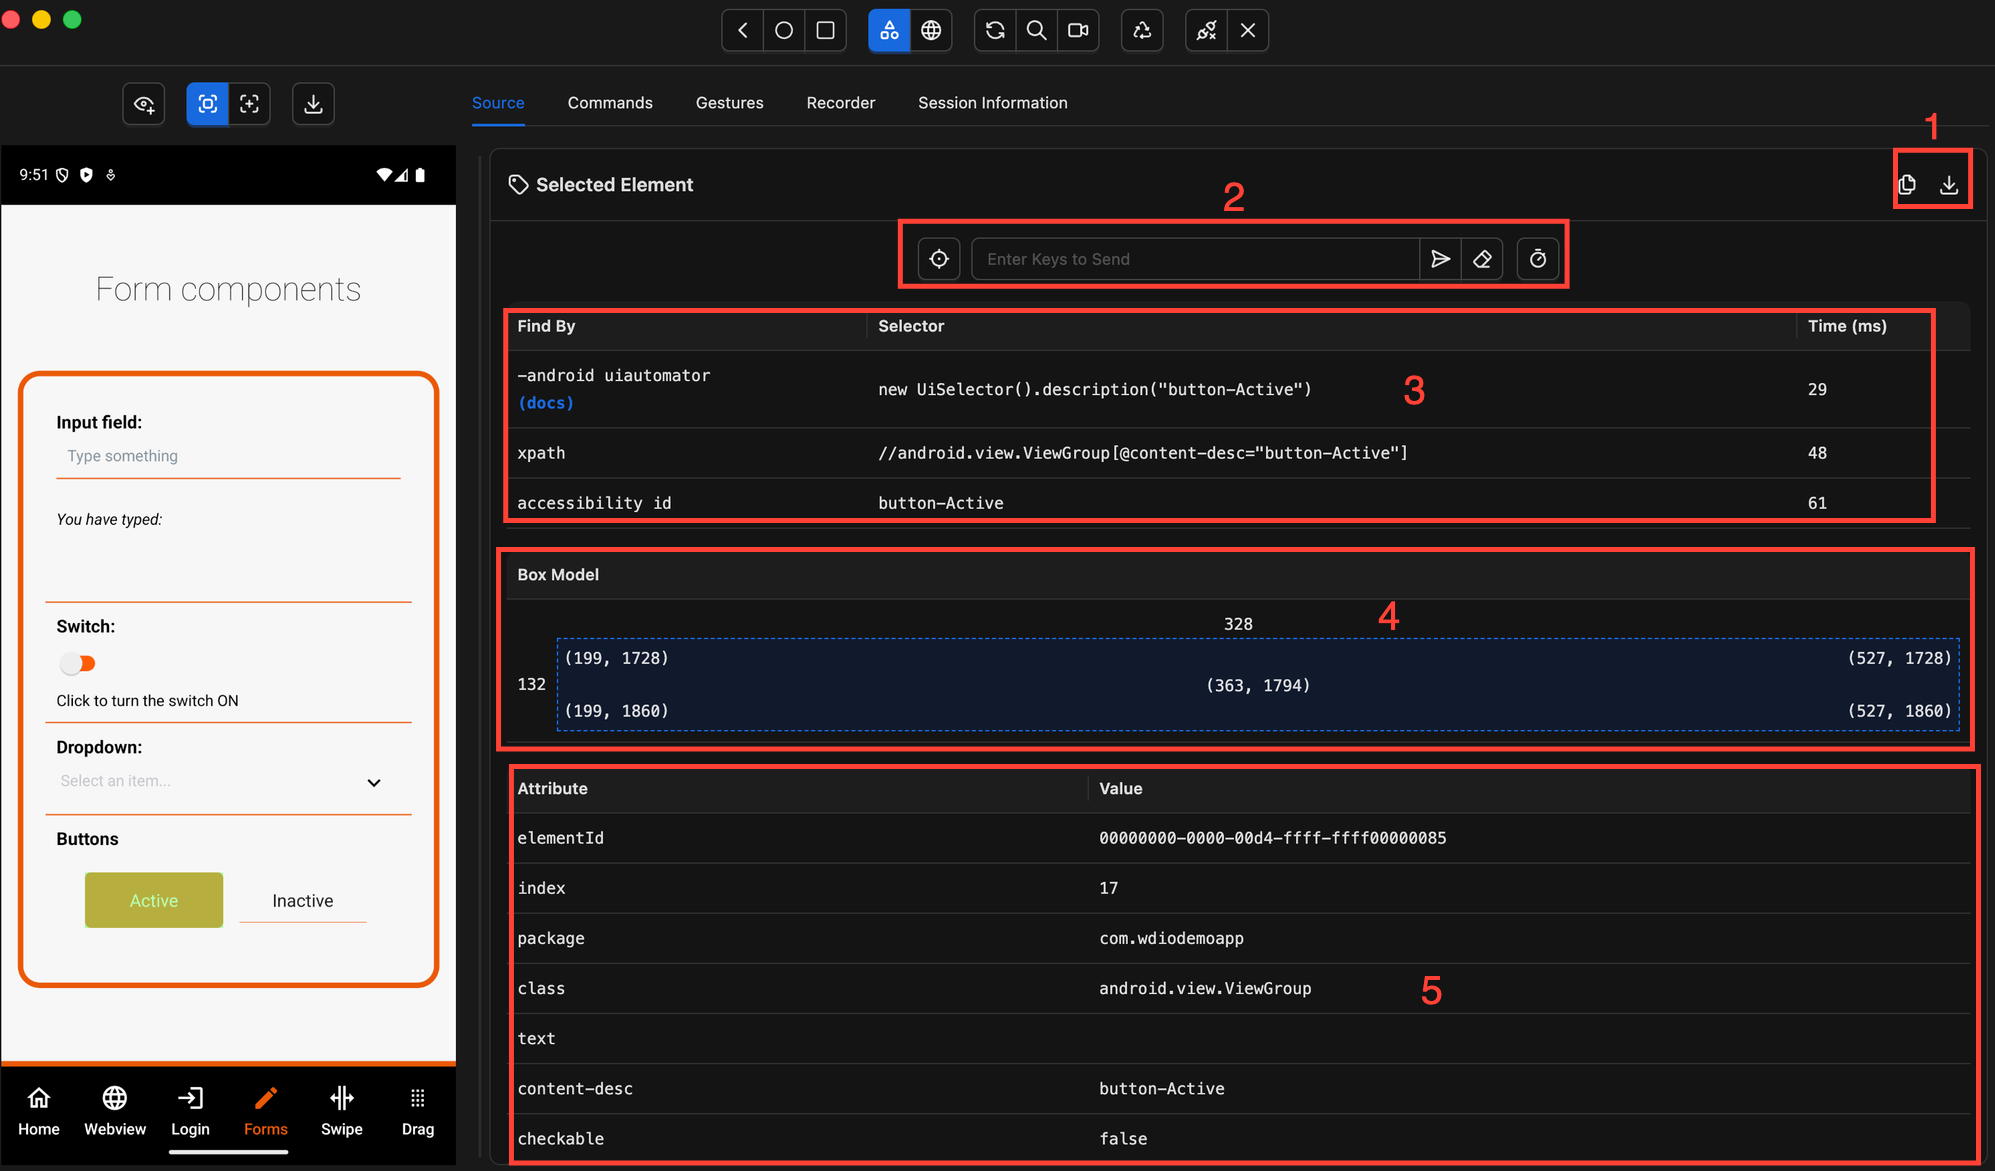
1. Header Buttons
- Copy all element attributes to the clipboard as a JSON array
- Download a screenshot of the selected element as a
.PNGfile
2. Element Action Buttons
- Tap — simulates a tap on the selected element
- Send Keys — types text into the element
- Clear — clears the current text in the element
- Run Timing Comparison — executes a search for each suggested locator and measures how long each one takes to find the element
3. Suggested Locators Lists one or more locator strategies and selector values that can be used to find the selected element in your automation scripts. Clicking on any selector copies it to the clipboard. The Run Timing Comparison button tests each suggested locator and adds a column to the table showing the elapsed time for each — useful for identifying the fastest and most reliable locator for that element.
4. Box Model Provides a visual reference for the element's position and dimensions on screen. It displays the element's width and height, the exact coordinates of each corner, and its midpoint — useful when you need to perform coordinate-based interactions.
5. Element Attributes A complete table of all attributes retrieved from the element, along with their values. Clicking on any value copies it to the clipboard.
Commands Tab
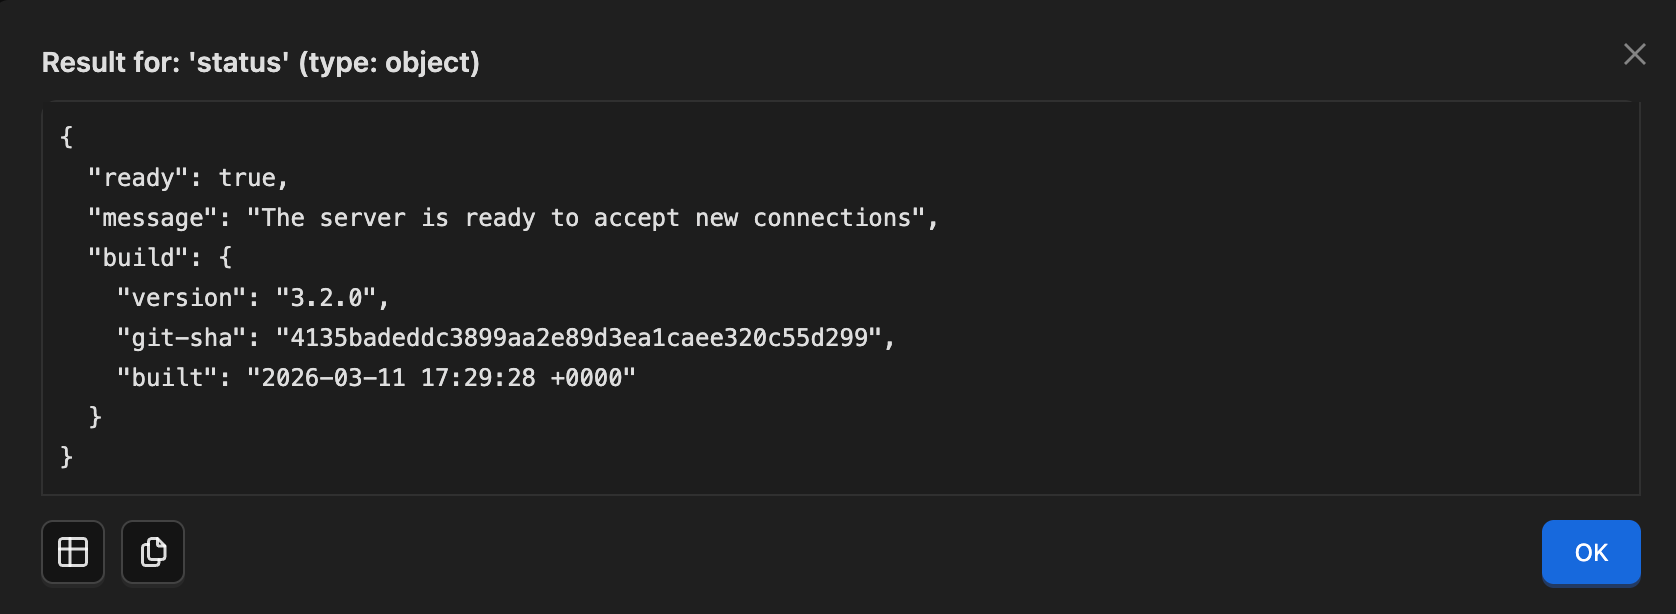
The Commands tab gives you a way to run Appium driver commands and execute methods directly from the Inspector interface — without writing any code.
Think of it as a control panel for your Appium driver. Instead of writing a Java method in your test script to execute a command, you can run it straight from Inspector and immediately see the result. This is particularly useful for testing unfamiliar commands or debugging your app's behaviour before committing to code.
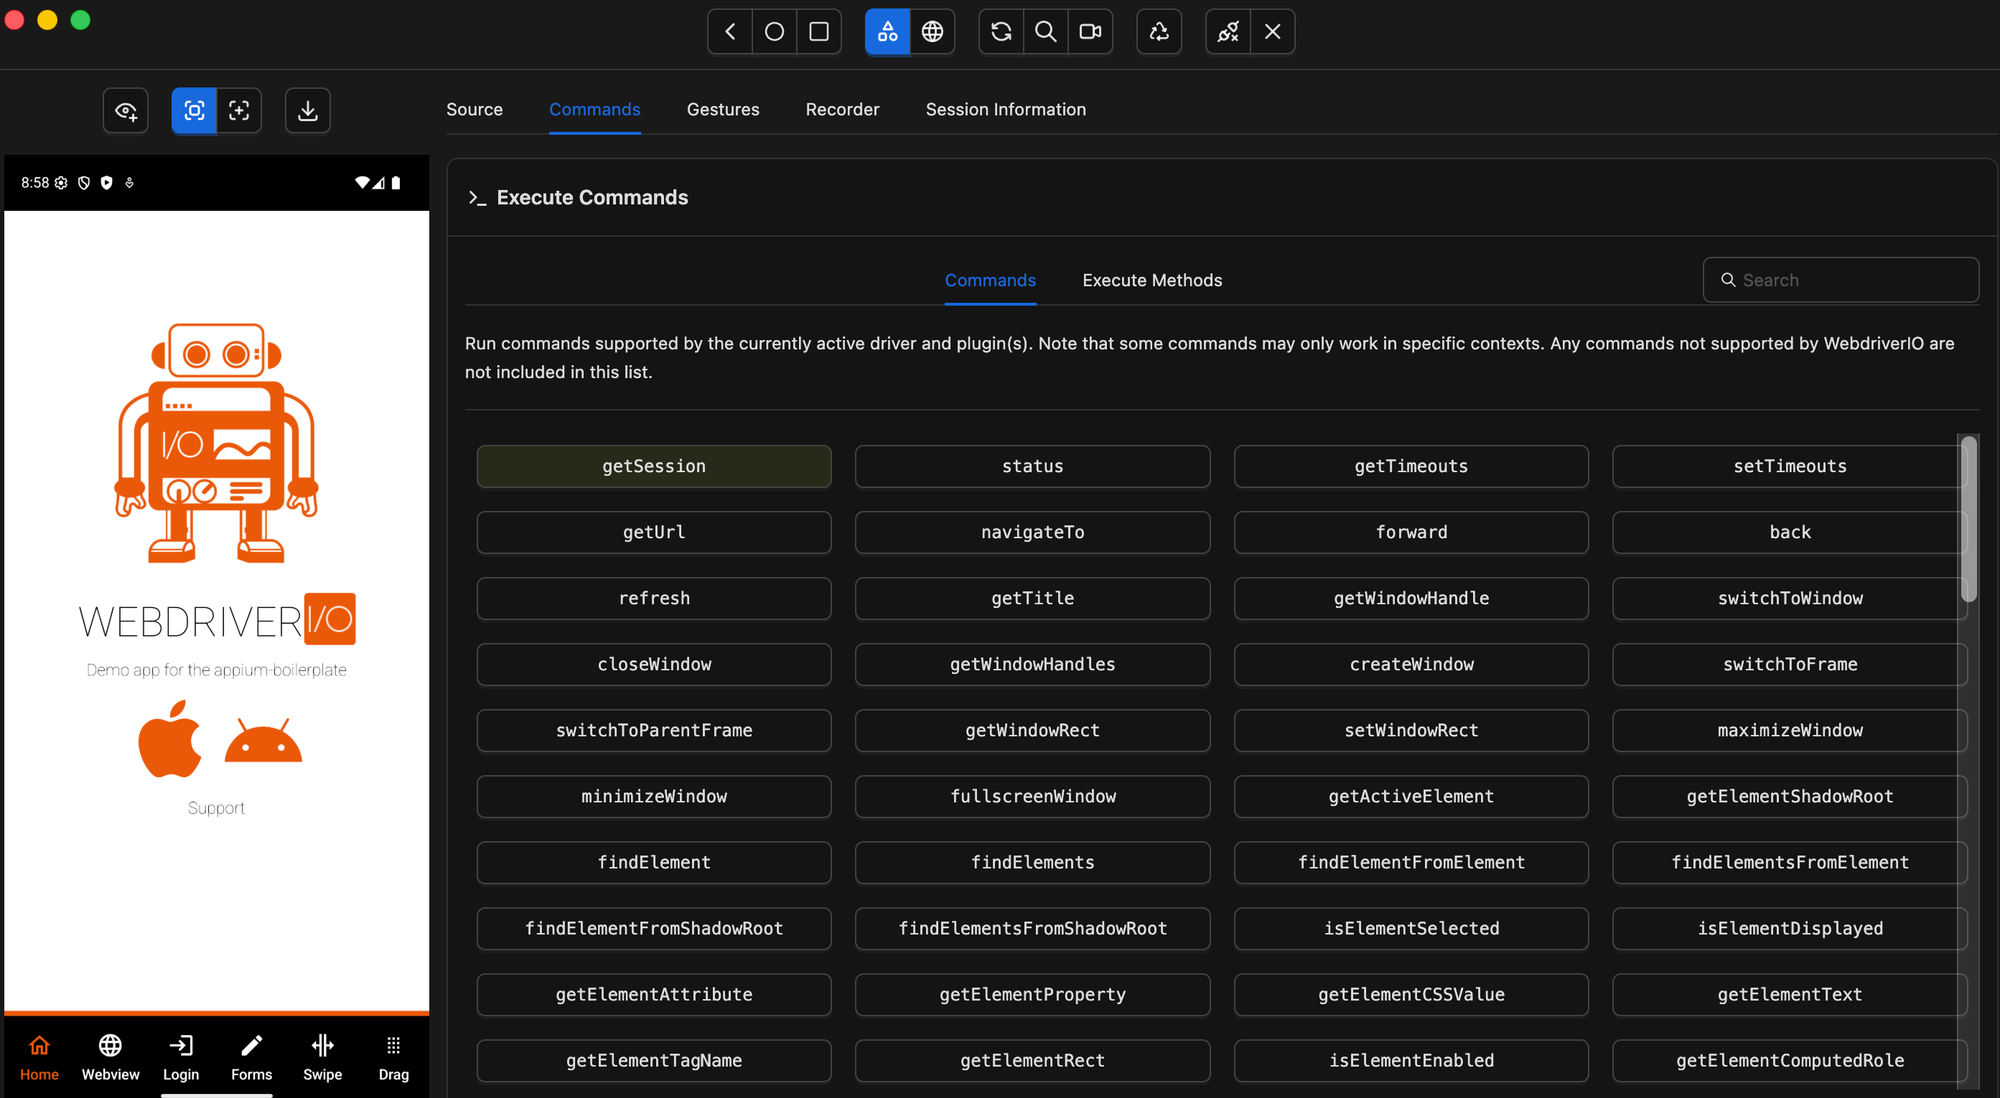
The list of available commands depends on which Appium driver is active in your current session. All drivers share a common set of standard protocol commands, but each driver can also define its own additional commands and execute methods specific to that platform. Appium Inspector retrieves this information directly from the active driver and adjusts the list automatically — so you will only ever see commands that are actually supported in your current session.
Gestures Tab
The Gestures tab is where you can create, save, and execute custom touch gestures — without writing any code. This is particularly useful when you need to test interactions like swipes, pinches, or multi-step drag actions before implementing them in your automation scripts.
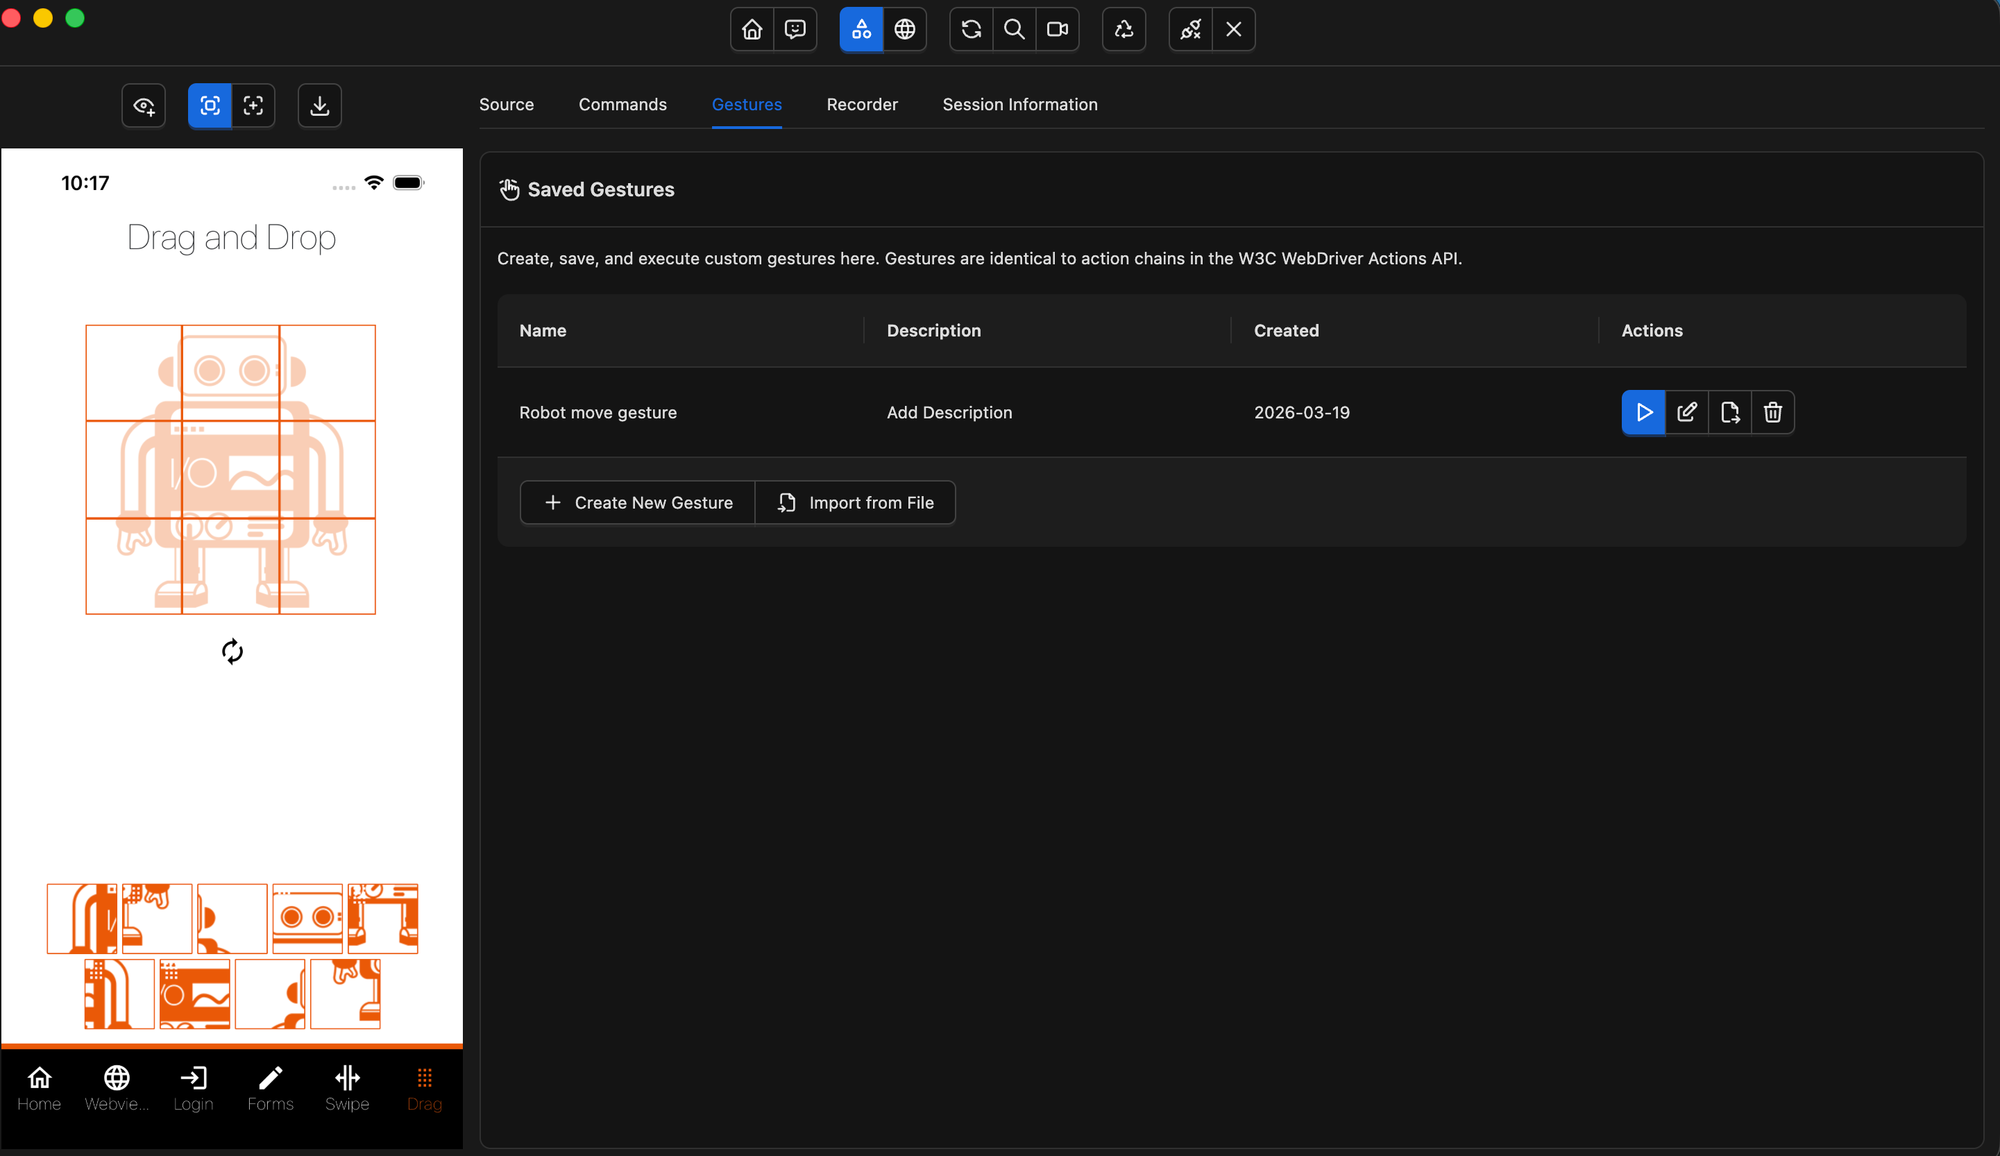
When you first open this tab, you will land on the Saved Gestures screen. If you haven't created any gestures yet, the list will be empty.
Creating a New Gesture
To create a new gesture, click the Create New Gesture button. This opens the Gesture Builder — a visual interface where you define your gesture step by step using a sequence of actions such as Move, Pointer Down, Pointer Up, and Pause.
Once you are happy with your gesture, save it and it will appear in the Saved Gestures list.
Working With Saved Gestures
Once a gesture is saved, hovering over it in the list will display a preview of its actions as an overlay directly on the app screenshot — giving you a visual confirmation of where and how the gesture will be executed on the device before you run it.
For each saved gesture, you have four options:
- Execute — run the gesture directly on the device or simulator
- Edit — open the gesture in the Gesture Builder to modify it
- Export — save the gesture as a
.JSONfile to share or reuse across projects - Delete — remove the gesture from the saved gestures list
Drag and Drop Gesture
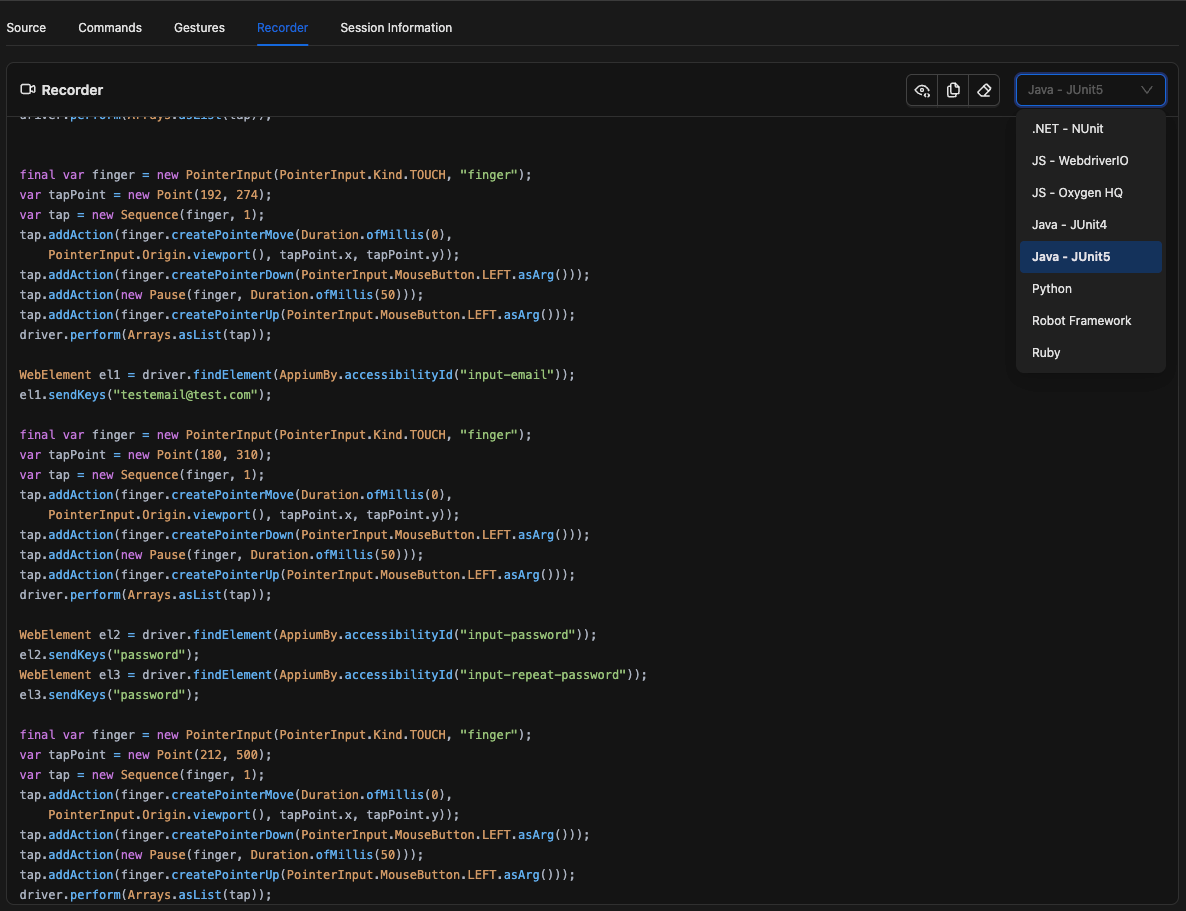
Recorder Tab
The Recorder tab automatically converts your interactions with the app into ready-to-use Appium client code — saving you the effort of writing it from scratch. It supports multiple programming languages, so regardless of whether you are using Java, Python, JavaScript, or another supported language, the generated code will be ready to copy directly into your test project.
By default, the tab is empty. This is because recording is not enabled automatically — you need to manually start it by clicking the Start Recording button in the Inspector header. Once enabled, every supported interaction you perform on the app is captured and translated into code in real time.
How to Use the Recorder
- Click the Start Recording button in the Inspector header to begin recording
- Interact with your app — tap elements, type text, swipe, or execute commands
- Switch to the Recorder tab to see the generated code populate in real time
- Use the language selector to switch between supported Appium client languages — any language change is applied instantly to all already-recorded code, so you do not need to re-record your interactions
- Copy the generated code and paste it into your test project as a starting point for your automation script
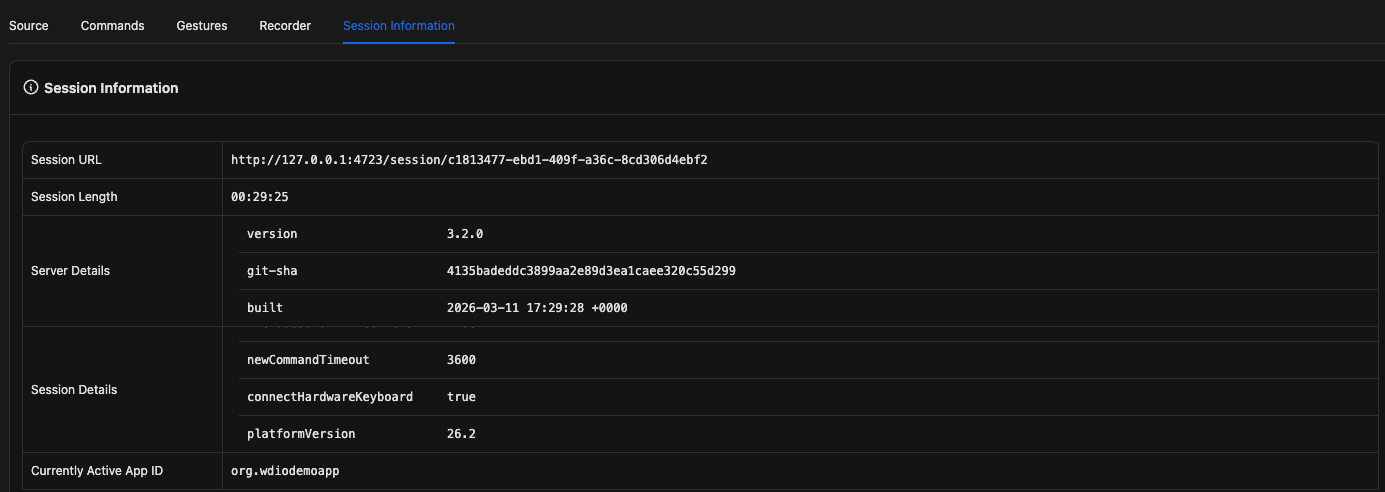
Session Information Tab
The Session Information tab gives you a quick overview of your current Appium session. It’s useful when you want to understand how your session is configured or reuse that configuration in your tests.
This tab is divided into two main sections:
1. Informational Tables (Top Section)
The top section displays key details about your session, including:
- The Appium server URL
- Server configuration details
- Desired Capabilities used to start the session
You’ll also see sub-sections like Server Details and Session Details, which you can scroll through to view more information.
2. Session Boilerplate (Bottom Section)
The bottom section provides ready-to-use example code for creating a session using your current configuration.
This boilerplate code includes:
- Required imports
- Session setup
- Basic teardown
You can copy and use this code as a starting point for your automation tests, saving you time and helping you avoid configuration mistakes.
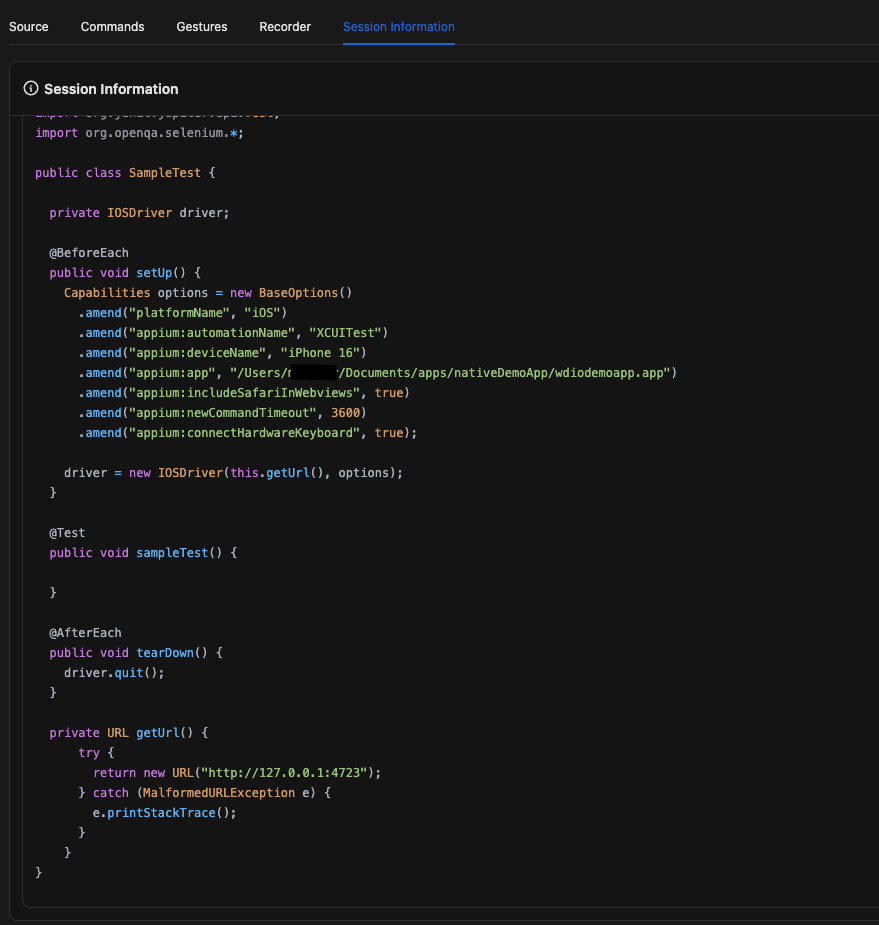
💡 Tip:
If your session is working correctly in Appium Inspector, you can copy the boilerplate code to quickly replicate the same setup in your test project.
What's Coming Up?
Up next, we'll tackle one of the most important decisions in mobile test automation: choosing the right locator strategy. We'll cover the different options available and the best practices for selecting reliable locators that won't break as your app evolves.


Discussion